Data Doesn't Rule Out Democratic Backsliding in the US
On Twitter, Andrew Little argued that democratic backsliding in the US (i.e., the US becoming a dictatorship) almost certainly won’t happen:
The only countries where this has happened are (1) far poorer than the US, and (2) have not been consolidated democracies for nearly as long. And these are good predictors.
— Andrew Little ((???)) August 28, 2020
Our baseline expectation should be that major democratic backsliding will almost certainly not happen. https://t.co/L4p5CJXzVC
Adam Przeworski says something similar at The Monkey Cage:
The probability that either the incumbent or the opposition would not respect the results of elections falls rapidly as a country experiences more alternations. For the U.S., which holds the world record having gone through twenty-two such events, this probability is 1 in 1.8 million elections.
(Obviously this is in response to Donald Trump refusing to commit to accepting the results of the election.)
My reaction to these claims is skeptical. How can we be so confident given the small number of examples we have? Can we really measure a probability as low as 1 in 1.8 million from a sample of maybe a hundred or so democracies?
Andrew pointed me to the The Democracy and Dictatorship Dataset (Cheibub, Gandhi, and Vreeland 2010) as the basis of his argument, which is conveniently available in the democracyData R package here. Przeworski doesn’t explain where his number comes from, but his published work suggests he ran a logistic regression (Przeworski and Limongi 1997).
After looking closely at the data, I think my skepticism is well-placed. The data can’t support this level of confidence, though backsliding is clearly unlikely.
There are two statistical issues that I think Little and Przeworski missed, and together they drastically lower our confidence. First, they report a point estimate (maximum likelihood) of the probability and ignore the uncertainty surrounding that estimate. We obviously can’t accurately measure a number as low as 1 in 1.8 million in this data, and the uncertainty overwhelmingly goes in the direction of higher probabilities. This is a known problem with rare events data– for example see King and Zeng (2001). Accounting for this uncertainty makes a huge difference to our confidence that we won’t see backsliding.
Second is the issue of effective sample size– they treat each year of democracy as an independent data point, when instead there are probably spatially and temporally autocorrelated errors. (That is, backsliding can occur in clusters in space and time.) That implies a smaller effective sample size, and a smaller effective sample size implies greater uncertainty.
To get started, I looked at the data with a survival analysis. I don’t think this is the best way to do the statistics, but it’s a useful way to get oriented and get a sense of what’s going on.
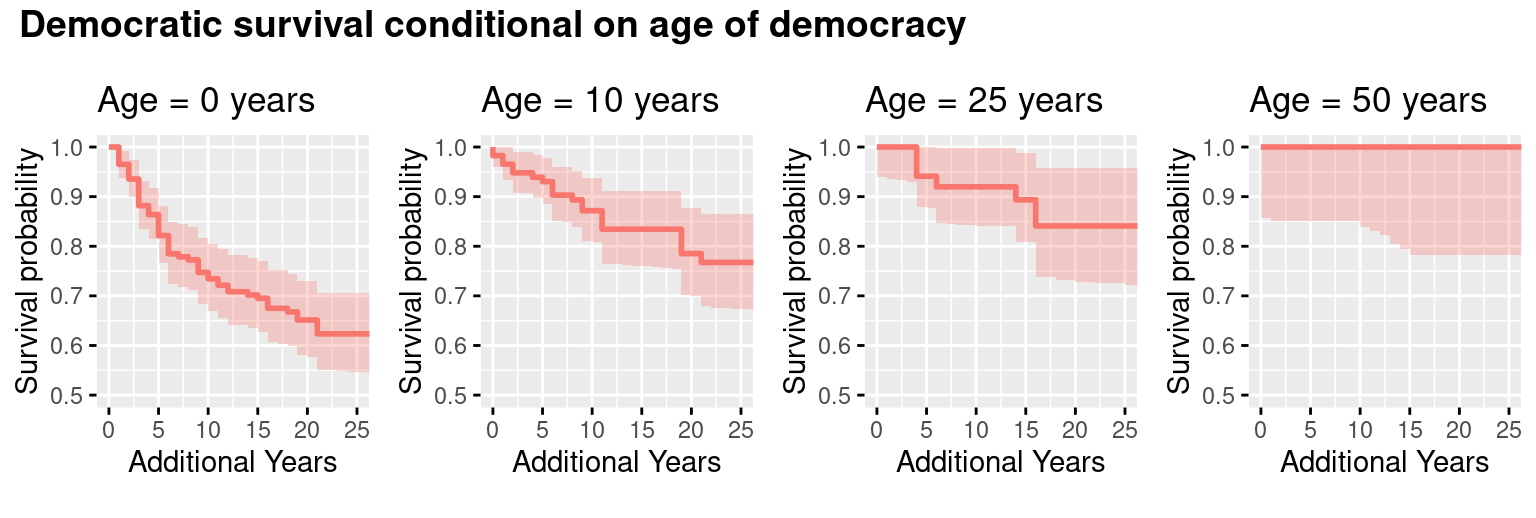
One thing that jumps out of this data is that older democracies are less likely to revert to dictatorship. For example, new democracies have about a 25% chance of becoming a dictatorship within 10 years. However, for democracies at age 50, 100% of them remained democracies 10 years later. That’s consistent with Little’s and Przeworski’s arguments.
But contrary to Little and Przeworski, this model displays a wide range of uncertainty about the true probability, where older democracies could have up to a 14% chance of backsliding (at the extreme end of the 95% confidence interval, which is the shaded area). The survival analysis approach isn’t the best here, though, because it assumes that each year has a separate probability. The probability of a 50-year-old democracy backsliding is estimated separately from the probability for a 51-year-old democracy, and so forth. The result is that each year has a small sample and the confidence intervals are very large, probably too large for this case.
Since there’s no visible change in the probabilities after democracies are 50 years old, a reasonable approach is to assume that the probability at that point is a constant. In this case we can lump all the years after 50 from different countries together (for a total of 1076 democracy years with no backsliding) and estimate the probability with a binomial model. Trying this approach in R, I get:
##
##  Exact binomial test
##
## data:  0 and years_ge50
## number of successes = 0, number of trials = 1076, p-value < 2.2e-16
## alternative hypothesis: true probability of success is not equal to 0.5
## 95 percent confidence interval:
##  0.000000000 0.003422457
## sample estimates:
## probability of success
##                      0
The probability according to the binomial model is between zero and 0.3%. That’s pretty low, and in line with Andrew’s tweet.
Quick math note: How do you calculate the probability of an event that hasn’t happened before? If you run a standard statistical test, like the binomial model I just ran, it’ll tell you the most likely probability is zero. But a zero probability doesn’t make sense as a prediction– we can’t say with total confidence that something won’t happen just because it hasn’t happened before. To get a better probability for predictions, we need to account for the possibility that the event happens but we haven’t seen it yet. I was surprised to find that this probability is just 1/(n+2), where n is the number of times the event hasn’t happened. This is a result of the rule of succession.
Let’s start applying this. At one extreme, we have the survival analysis approach, with a sample size of 25 (the number of older democracies in the dataset), implying a backsliding probability of 3.7%. At the other extreme is the constant probability approach, with a sample size of 1076, implying a backsliding probability of 0.1%.
While the survival analysis is clearly too conservative, I think the alternative goes too far in the other direction due to its assumption that all democracy years are independent. It’s easy to think of counterexamples: In the US, the president probably influences the probability, but the president usually only changes once every 4 years or less. Economic downturns like the 2008 recession affect many countries at once. Events like the Arab Spring can temporarily affect backsliding probabilities for an entire region.
We end up with a question of effective sample size. Out of 1076 democracy years, how many truly independent samples do we have? The graph below plots the range of probabilities:
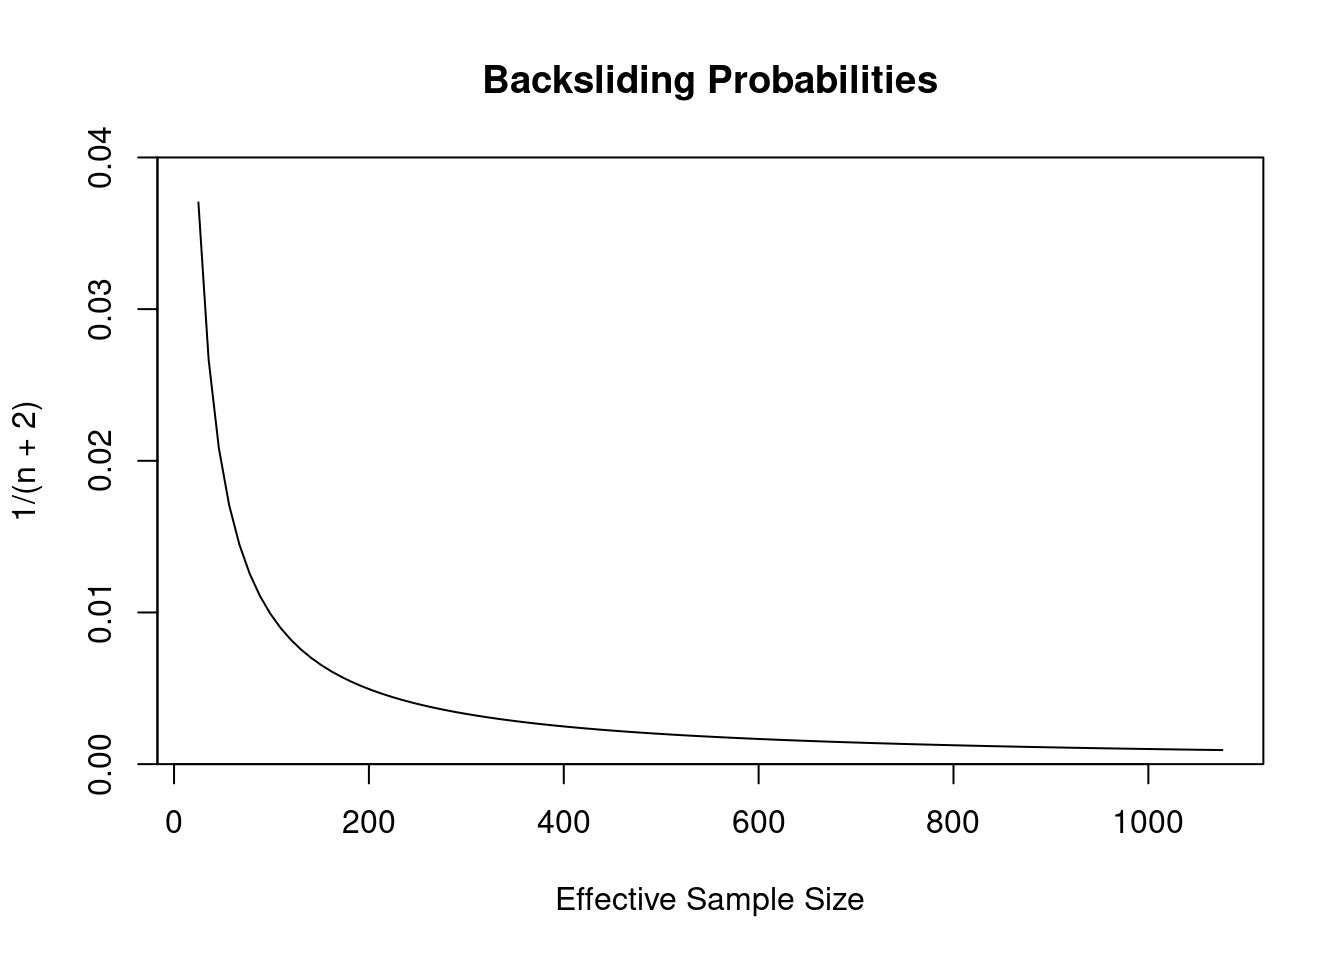
I don’t have a good way of deciding between these probabilities except that I think we can rule out the extremes, so I think we’re looking at a probability in the range of 0.2% to 1%. That’s about 10,000 times higher than Przeworski’s probability.
I hate to say it, but we can’t stop here. This is just a prior, which doesn’t account for the details of any given year. If we want to know the risk we face specifically in 2020 we should look at a posterior formed after including the other information we have about 2020.
The salient issue in 2020 is that we have a malevolent president who refuses to commit to accepting the results of the election and a major political party that’s reluctant to rein him in. Intuitively I think we all expect the probability of backsliding to increase in this situation. In terms of Bayes’ theorem, what we want to know is P(Backsliding|MalevolentPresident), where P(Backsliding) is between 0.2% and 1%.
Unfortunately I don’t have enough information about the other terms in the equation to calculate this properly, so I’m not going to provide a number here and claim I know the probability of American backsliding in 2020. However it’s easy to find plausible numbers that lead to backsliding probabilities like 5 or 10% or even higher.
Given the uncertaintly surrounding the numbers, the conclusion from this analysis is less about what we can say and more about what we can’t say. The data we have can’t rule out the possibility that there are rare situations where old democracies are at an elevated risk of backsliding, and 2020 could be one of those occasions.
References
Cheibub, José Antonio, Jennifer Gandhi, and James Raymond Vreeland. 2010. “Democracy and Dictatorship Revisited.” Public Choice 143 (1): 67–101. https://doi.org/10.1007/s11127-009-9491-2.
King, Gary, and Langche Zeng. 2001. “Logistic Regression in Rare Events Data.” Political Analysis 9 (2): 137–63. https://doi.org/10.1093/oxfordjournals.pan.a004868.
Przeworski, Adam, and Fernando Limongi. 1997. “Modernization: Theories and Facts.” World Politics 49 (2): 155–83. https://doi.org/10.1353/wp.1997.0004.