Outbreak Economics
Discussions of the policy response to coronavirus outbreaks have been pretty informal, and occasionally I see people claim that the optimal policy response sets R (the coronavirus reproductive number) to 1, which isn’t exactly right. I think it’s worth working through a simple model to see why, and to provide a formal framework for evaluating policy options.
Let’s say we can set public policy once a week, and \(Y\) is the output this week (in a wide-ranging sense that includes both traditional economic goods and health). For a simple model, we can say \[ Y(R) = Y_0 - V(R) - p(R) \] where \(Y_0\) is the normal output we’d get without any new coronavirus infections, \(V\) is the cost of new virus infections, and \(p\) is the cost of preventative measures that lower \(R\). \(Y\), \(V\), and \(p\) all depend on \(R\).
It costs more to acheive lower \(R\) values, so \(p(R)\) decreases monotonically with \(R\). \(R\) is controlled indirectly by policymakers, as a result of the preventative measures they choose to take.
Let’s also say that \(V\) increases proportionally to the number of current coronavirus cases and the average cost per case. Since this is a weekly cost, and the virus’ serial interval is close to a week, we can say that \(V\) is approximately \[ V(R) = R \times cost \times cases \] That is, \(V\) is the number of new infections (\(R \times cases\)) times the cost per infection. (If we wanted to look at longer periods, we’d have to raise \(R\) to a power to reflect exponential growth.)
Let’s also assume that we can’t completely eradicate the virus– if we did eradicate it, it would just get reintroduced from another country.
A bit of calculus shows that output is maximized when \[ -\frac{dp}{dR} = \frac{dV}{dR} = cost \times cases \] that is, when the marginal cost of prevention with respect to \(R\) equals the marginal cost of infections with respect to \(R\). This is shown in figure 1, where I’ve labeled the optimal \(R\) value \(R^*\).
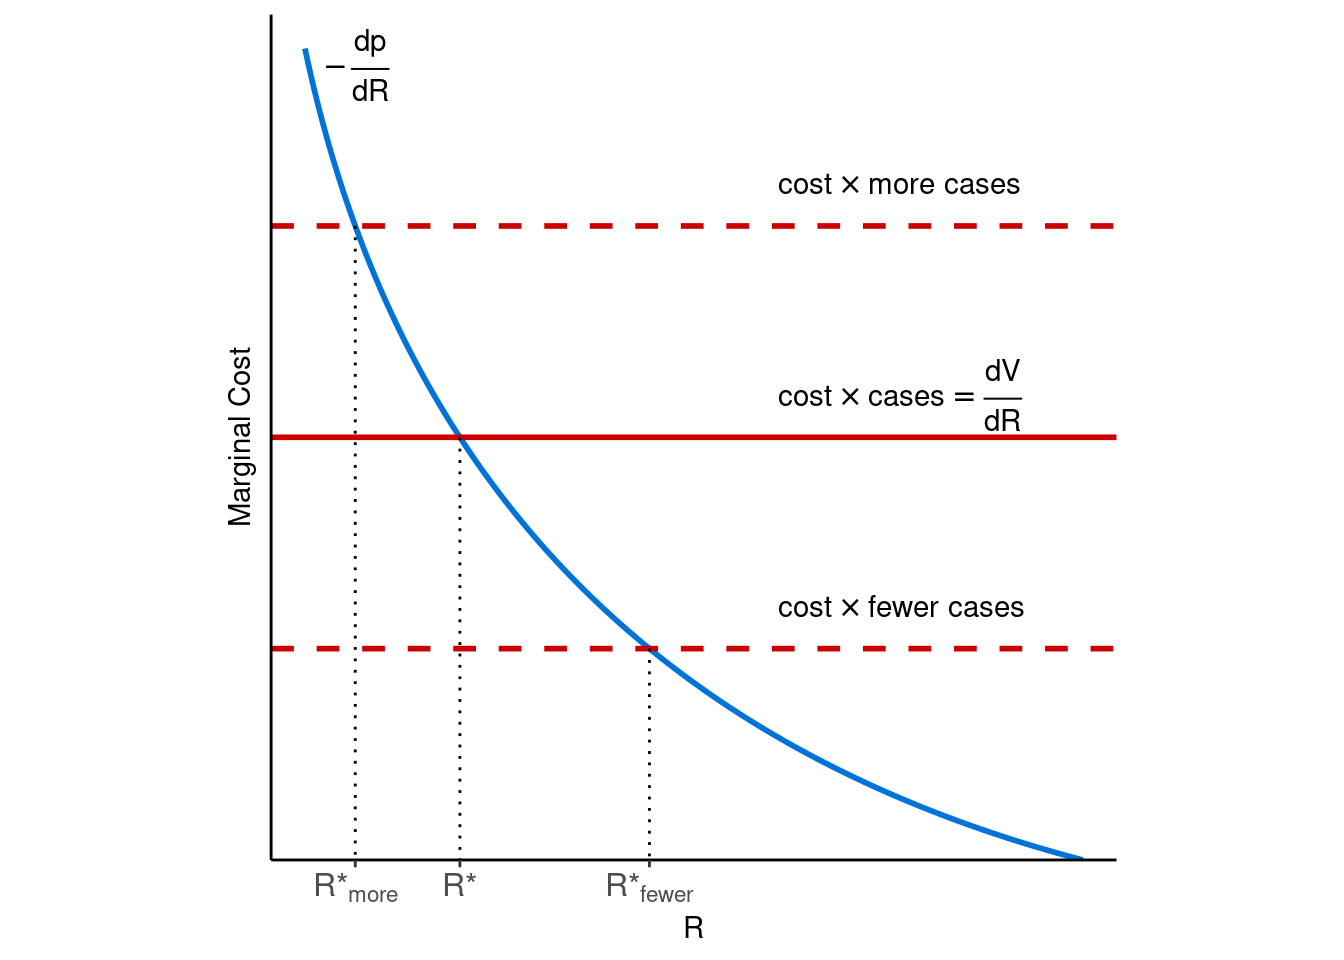
Figure 1: Optimal R values (R*) for diffent numbers of infections.
This figure clearly shows what some people have missed, that the optimal policy (and the optimal \(R\)) depends on the number of current infections. If many people are infected, the cost of holding \(R\) at 1 and allowing new infections is high, so society can benefit by pushing \(R\) lower. If there are few infections, it may make sense to temporarily relax precautions and allow an \(R\) above 1.
Conveniently for modelling, a country following this strategy will eventually reach a steady state at \(R = 1\) and \[ cost \times cases = -\frac{dp}{dR}(1) \] where the number of new cases remains constant. When a country holds \(R\) below 1, the number of cases fall, and in response the country raises \(R\). And when a country holds \(R\) above 1, the number of cases rises, leading the country to lower \(R\).
This lets us investigate the effects of changes of different variables. For example, what happens if coronavirus is less contagious in summer than winter, making it easier to acheive lower \(R\) values? Figure 2 shows the affect on the steady state. In this case, the optimal number of infections is higher in the winter than in the summer, even though \(R\) is still held at 1 in both (higher marginal cost implies more cases, other things equal).
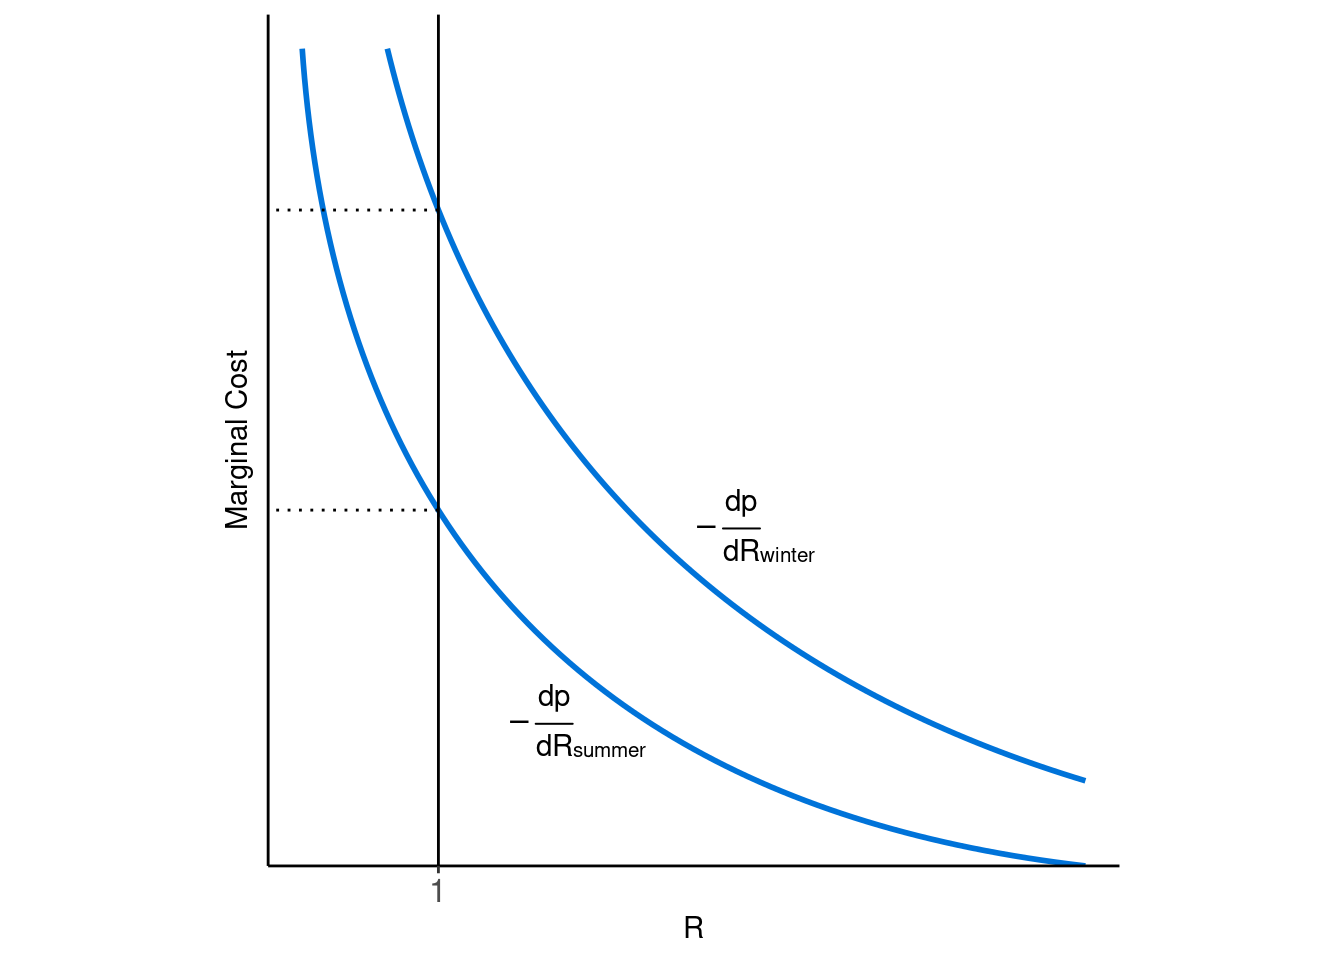
Figure 2: Seasonal changes in steady state policy responses.
One question I want to try to answer is, how does this end? The optimal steady state holds R at 1, which currently requires a lot of effort, and this line of reasoning says we’re going to be stuck here for a while.
But in the longer term, if we get more efficient at keeping R down, for example by getting good at testing and tracing, then we can ease off on the more costly precautions while still keeping R at 1. A vaccine or a gradual build-up of immune people would have a similar effect by helping to push down R.
Interestingly, if we get better at treating coronavirus, so that the average cost of an infection decreases, then we can tolerate more infections, and thus can ease off precautions temporarily, but we still end up taking the same precautions in the steady state. Even though the average infection cost is lower, eventually that’s offset by the higher number of cases (though it could help by contributing to immunity). An exception occurs if we become extremely good at treating the virus, in which case even at the peak number of cases we might be willing to tolerate more infections, so we never reach the new steady state and we can stay relatively relaxed about infections.
As I was writing this, I found out I was beat to the punch by Martin Eichenbaum, Sergio Rebelo, and Mathias Trabandt, who reach similar conclusions with a fuller and more formal model (and they’re brave enough to plug in some numbers too). Their paper is available here. They also provide citations to a bunch of related research. They even provide their Matlab code, which is probably worth playing with if you’re interested in this. I also found some useful discussions in a health economics textbook, so it’s not a bad idea to take a look at one of those.